Resources for Lab 3
Practice 1
- Download the
employees.xlsx. - Create an R Project where to analyse the
employees.xlsxdataset and move thexlsxfile within the project directory. - Get the path to the data using the
here()function. - Import the dataset in R with the
read_xlsx()function.
How many observations are collected in the dataset? Use the
dim()function.What’s the average salary in the company? Use either the function
mean()orsummary()
Use
filter()andarrange()to check who are the three top earners in theI.Tdepartment.Use
group_by(),summarise()andmedian()to get the median salary in theI.T.department.
Using geom_point(), construct a scatterplot for salary and seniority, colored by department. Store it in my_plot. Try adding a theme to the plot, for example:
my_plot + theme_minimal()What happens?
- Use
labs()to modify the labels of the plot. For example:
my_plot + theme_minimal() + labs(x="Seniority (years)", y="Salary", color="Department:")- Use
facet_grid()to create a multi-window plot
my_plot + facet_grid(~department)- Export your plot with the function
ggsave()
my_great_plot <- my_plot + theme_minimal() + labs(x="Seniority (years)", y="Salary", color="Department:")+ facet_grid(~department)

ggsave(my_great_plot, filename = here("great_plot.jpeg"))- Use
group_by()andsummarise()to compute the average and total expenditure for salaries by department
How many employees have just been hired in the company?
How many employees have just been hired in the I.T. department?
Compute the average salary of employees from the Finance department with at least 8 years seniority.
Create a summary table where you report:
the median salary by department (using the function
median()),the number of employees by department (using the function
n()),the number of new hired by department.
Save it as an excel file via the write_xlsx() function.
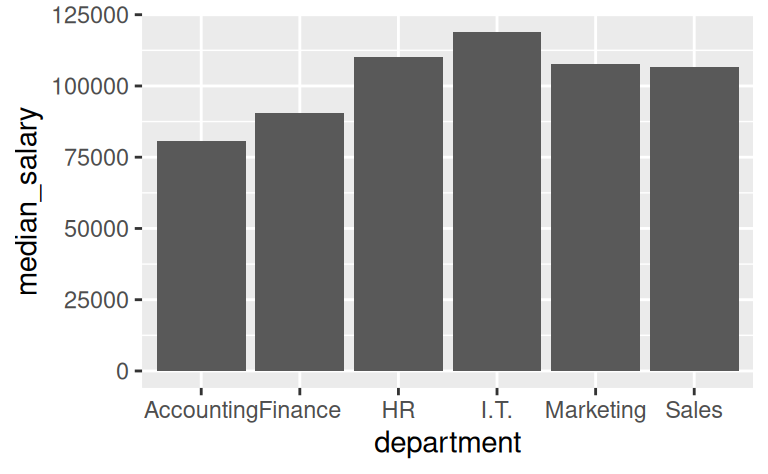
Given the summary table in the previous exercise, reproduce the following bar plot of the median salary by department (hint: use geom_col()).
You have to create an Excel file where employees from different department are collected in different sheets.
In R, you can create multi-sheets Excel files by feeding write_xlsx() with a list of datasets. Assume you stored the original employees.xlsxdataset in the dataframe dt. Now, try running
my_departments <- split(dt, dt$department)What does the
split()function do? Run?split()to read the documentation.What kind of object is stored in
my_departments? Runtypeof(my_departments)to investigate.Feed
write_xlsx()withmy_departmentsto create a multi-sheet Excel file.
Practice 2
- The HR department sent you the employees file from a different company.
- Download the
employees_company2.xlsxand import it in R. - As you can see, the file has a structure that is very similar to the previous database. Nevertheless, it presents two critical issues:
- Column names do not follow a consistent notation. Sometimes they are capitalized, sometimes they are not. Some times they includes spaces, sometimes they do not.
- There are missing values
Use the function clean_names() from the janitor package to tidy up column names automatically
- How many missing values are present in the salary column? Use the
summary()function. - Replace missing values with the median salary of department the missing value belongs to.